

TL;DR:
- Moving costs in 2026 vary widely based on distance, weight, seasonality, and route demand.
- Families can reduce expenses by decluttering, scheduling mid-week, and requesting binding estimates.
- Accurate cost planning relies on live data, early preparation, and understanding market factors.
There is no single official 2026 interstate moving cost report from any federal agency or major authority. If you have searched for one, you have likely landed on company blogs or aggregated estimates that vary wildly. The truth is that moving costs are highly variable and depend on dozens of real-world factors unique to your situation. This article gives you an evidence-driven breakdown of what families are actually paying in 2026, how the numbers are calculated, and exactly what you can do to keep costs under control before you sign anything.
Table of Contents
- Breaking down interstate moving costs in 2026
- Real route data: Typical price ranges for 2026
- Comparing methodologies: Where do the numbers come from?
- Cost-saving strategies and edge cases in 2026
- Our take: Why moving cost planning matters more in 2026 than ever
- Get your personalized 2026 moving quote today
- Frequently asked questions
Key Takeaways
| Point | Details |
|---|---|
| No universal cost report | Interstate moving costs are variable and no official fixed-rate report exists for 2026. |
| Demand and season matter | Peak summer moves often cost 20-40% more than off-peak dates. |
| Data-driven planning works | Use live, reputable data sources and binding estimates for accuracy and better outcomes. |
| Major routes have ranges | Common cross-country moves typically cost from $4,500 to $12,000 for families in 2026. |
| Actionable savings possible | Decluttering, flexible scheduling, and using calculators can cut costs substantially. |
Breaking down interstate moving costs in 2026
Every interstate move is custom quoted. There is no flat rate, no universal price list, and no government-set fee schedule. What you pay depends on a combination of factors that shift constantly, much like airline ticket pricing. A move that costs one family $4,800 could cost another family $9,200 for a similar distance simply because of timing, inventory weight, or route demand.
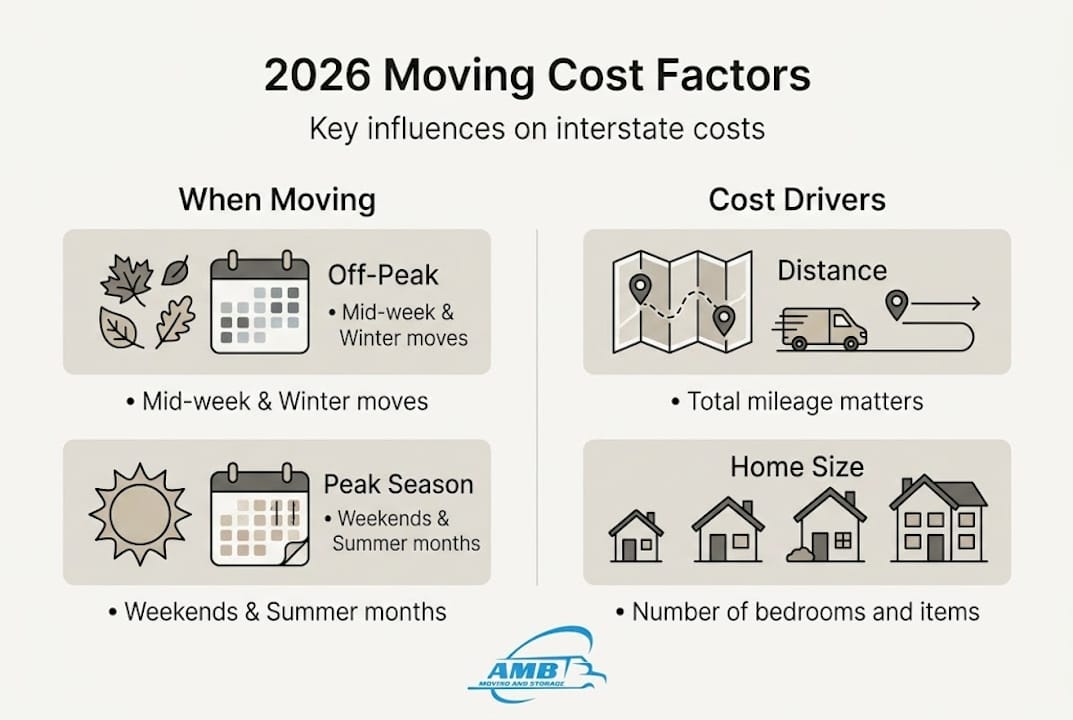
The core moving cost factors that drive your final quote include:
- Distance: The number of miles between origin and destination is the baseline for every quote.
- Weight or volume: Movers weigh your shipment or estimate cubic footage. More stuff equals more money.
- Seasonality: Summer moves (May through September) carry a 20 to 40% premium due to peak demand.
- Route demand: Popular corridors like California to Texas cost more than less-traveled routes.
- Fuel costs: Diesel prices directly affect carrier rates and are adjusted regularly.
- Labor: Loading, unloading, and packing crew hours are billed separately or bundled.
- Access conditions: Stairs, long carry distances, and elevator waits add fees.
- Add-ons: Packing services, specialty item handling, and storage all increase the total.
According to moveBuddha’s data approach, pricing in the moving industry functions similarly to dynamic transportation markets, where rates respond to supply and demand in real time. This means a quote you receive today may differ from one you get in three weeks.
The FMCSA requires all interstate movers to provide a written estimate before your move. You have the right to request one, and no reputable carrier should refuse. Always confirm interstate move requirements before booking.
Pro Tip: Schedule your move mid-month and mid-week if possible. Demand drops significantly on Tuesdays and Wednesdays, and avoiding the first and last days of the month can reduce your quote by 10 to 15%.
Real route data: Typical price ranges for 2026
With cost factors clear, let’s look at what real families are actually paying for specific moves. These benchmarks are based on empirical 2026 route data for the most common household sizes and corridors.
| Route | Home size | Off-peak estimate | Peak season estimate |
|---|---|---|---|
| East Coast to West Coast | 2 to 3 BR | $4,500 to $6,500 | $6,500 to $7,500 |
| New York to Texas | 2 to 3 BR | $3,800 to $5,500 | $5,500 to $7,200 |
| Chicago to Florida | 2 to 3 BR | $3,200 to $5,000 | $5,000 to $6,800 |
| Cross-country average | 2 to 3 BR | $5,000 to $8,500 | $8,500 to $12,000 |
| Studio or 1 BR | Any route | $1,200 to $3,500 | $3,500 to $5,000 |
These ranges reflect full-service moves with loading, transport, and unloading. Packing services, specialty items, and storage are not included in these figures.
One statistic worth noting: a cross-country move for a 2 to 3 bedroom home can run anywhere from $5,000 to $12,000 depending on timing and inventory. That is a $7,000 swing. The difference between the low and high end is almost entirely within your control through planning.

For in-depth route data on specific corridors, including cost per mile breakdowns, you can access route-level analysis that goes beyond generic averages. Live averages from moveBuddha also track seasonal shifts as they happen.
Pro Tip: Decluttering before your move can cut 20 to 35% off your total cost. Movers charge by weight, so donating or selling furniture you were planning to replace anyway is one of the highest-return actions you can take before moving day.
Comparing methodologies: Where do the numbers come from?
All costs are not calculated equally. Here is how trustworthy services do it, and why it matters for the numbers you rely on.
Major data platforms use large, continuously updated datasets to track pricing trends. moveBuddha, MoveSmart, and HireAHelper use live, large datasets for pricing trends, pulling from thousands of actual quotes and completed moves. HireAHelper tracks millions of moves for U.S. cost data, giving their migration reports statistical weight that a single company’s blog simply cannot match.
| Data source | Strengths | Weaknesses |
|---|---|---|
| moveBuddha | Large dataset, updated regularly, methodology published | National averages may miss local nuance |
| HireAHelper | Millions of moves tracked, migration trends included | Focused on labor-only moves, not full-service |
| Company blogs | Route-specific, service-specific context | May reflect only their own quotes, not market-wide |
Here are best practices for evaluating any moving cost source:
- Check whether the platform publishes its data methodology.
- Avoid reports that cite a single year without showing how data was collected.
- Verify that any mover you contact is FMCSA licensed before trusting their estimates.
- Use the moving cost guide as a structured starting point for your own research.
- Cross-reference at least two independent sources before budgeting.
The AMB Moving Services dataset draws from real route quotes and is updated to reflect current market conditions, making it one of the more actionable resources for families planning a move in the next 30 to 60 days. For a broader comparison, reviewing how leading state-to-state movers structure their pricing can also help you ask the right questions.
Cost-saving strategies and edge cases in 2026
After seeing what the data says, here is how to use that information to save real money and avoid common pitfalls.
One of the most important distinctions in any moving contract is binding versus non-binding estimates. A binding estimate locks in your price regardless of actual weight. A non-binding estimate can increase after weighing your shipment. Under FMCSA rules, movers using non-binding estimates cannot charge more than 110% of the original quote at delivery. That cap protects you, but it still means your bill could be 10% higher than expected.
Edge cases that push costs higher:
- California and New York origins are consistently the most expensive due to high labor costs and outbound demand.
- Summer surges (June through August) add 20 to 40% across nearly every route.
- Stairs and elevators at either location add labor fees that are often not included in initial quotes.
- Rural destinations may require shuttle services if a full truck cannot access your street.
According to 2026 state-level trends, inbound moves to the Southeast tend to be cheaper due to high carrier availability from migration patterns. If you are moving to Georgia, Tennessee, or the Carolinas, you may find more competitive pricing than routes heading toward the coasts.
Practical steps to reduce your total cost:
- Declutter aggressively before your inventory is assessed.
- Request binding estimates from at least three FMCSA-licensed movers.
- Choose flexible move dates, especially mid-month and mid-week.
- Ask movers specifically about access fees before signing.
- Book at least 6 to 8 weeks in advance for summer moves.
For families working through the full logistics of minimizing interstate costs, a structured approach to planning makes a measurable difference. A dedicated move planning guide for families can help you sequence every decision in the right order.
Pro Tip: Use online moving calculators to generate a personalized estimate before contacting any carrier. Having a benchmark number puts you in a stronger negotiating position and helps you spot quotes that are unrealistically low.
Our take: Why moving cost planning matters more in 2026 than ever
Here is something most moving articles will not tell you: the families who get burned by unexpected costs are almost never the ones who did zero research. They are the ones who did surface-level research and stopped there. They found a number on a blog, assumed it applied to their situation, and were blindsided when the final bill arrived.
Relying on outdated or cookie-cutter cost reports is one of the fastest ways to derail a relocation budget. The moving market in 2026 is more dynamic than it has been in years, with fuel costs, labor availability, and migration patterns all shifting faster than annual reports can capture. No single definitive report exists; the best insights come from data-driven platforms that update live.
The smartest families we work with do three things: they get binding quotes early, they use live data tools to benchmark those quotes, and they start planning at least 60 days out. That combination gives them both pricing leverage and flexibility. For cost and rule clarity that goes beyond generic advice, the difference between a stressful move and a smooth one is almost always preparation.
Get your personalized 2026 moving quote today
You now have the data, the benchmarks, and the strategies. The next step is getting a number that is specific to your move, not a national average.
At AMB Moving & Storage Inc., we provide fully transparent, FMCSA-compliant written estimates with no hidden fees. Our long-distance moving service covers all 50 states, and our team works with your timeline and budget to find the most cost-effective solution. Whether you are moving a studio apartment or a five-bedroom home across the country, our step-by-step family guide walks you through every decision. Get your personalized quote at ambmovingservices.com/quote and take the guesswork out of your 2026 move.
Frequently asked questions
What is the average cost for a cross-country move in 2026?
For a typical 2 to 3 bedroom move, expect a range of $5,000 to $12,000 depending on distance, timing, and add-on services.
How can I get the most accurate interstate moving quote?
Prioritize binding estimates and FMCSA verification from at least three licensed movers, and use online calculators to benchmark quotes before you commit.
Are moving costs higher in the summer of 2026?
Yes, peak summer premiums typically add 20 to 40% to your total cost due to high demand from May through September.
Which states are the most expensive or cheapest to move between in 2026?
California and New York are among the most expensive origins, while Southeast inbound moves tend to be cheaper due to favorable migration patterns and carrier availability.
What are common add-on costs I should plan for?
Expect extra charges for packing, stairs, and storage as well as specialty item handling and additional insurance coverage beyond basic liability.